Skincare
Body Composition Analysis for Diet Progress in Kyalami
· The Glow Up Society
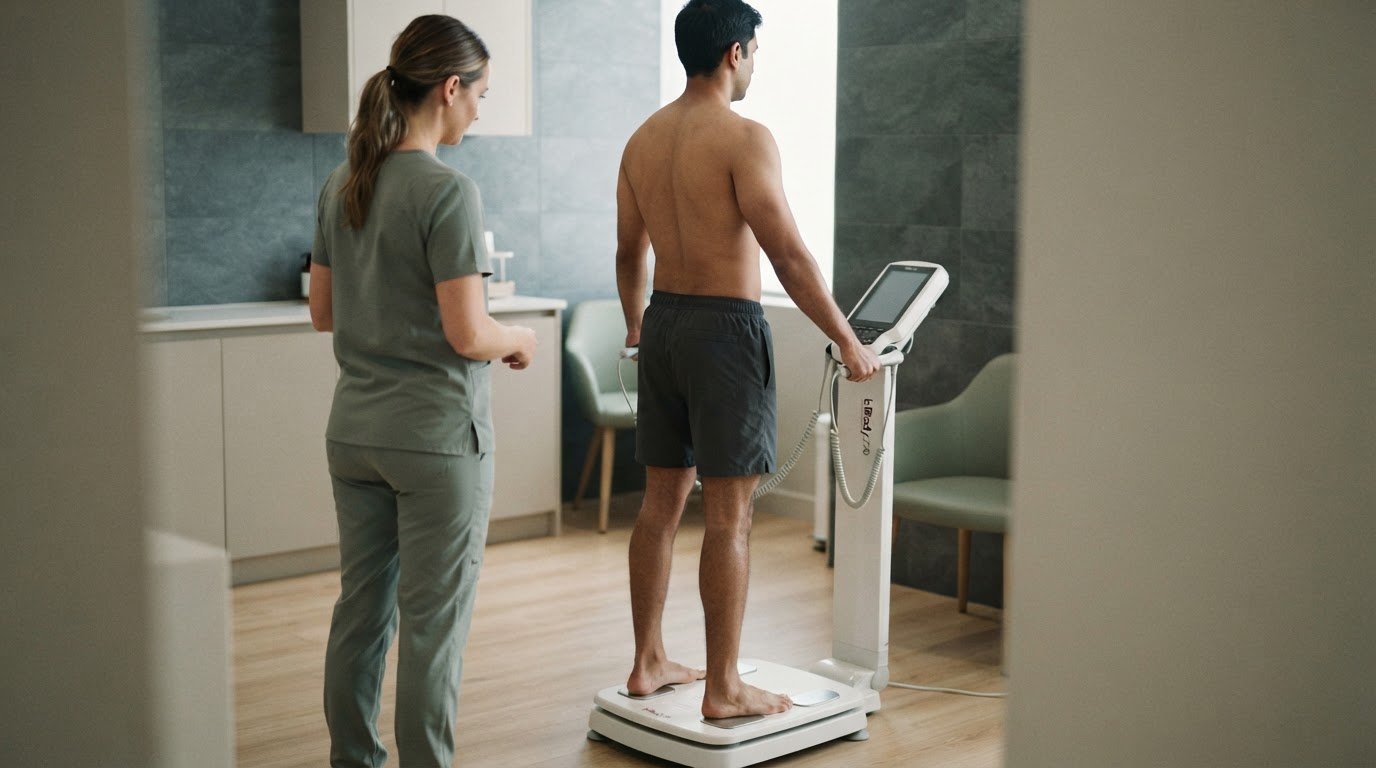
The scale alone can’t show how your body composition changes during a diet. Body composition analysis before and after a diet in Kyalami gives you readings to compare over time, helping you look beyond weight alone when reviewing your progress.
It’s understandable to want clear signs that your routine is moving you towards your goals. A follow-up assessment can add useful context to your results, while keeping the focus on your individual progress rather than a single number.
Here, you’ll learn what a body composition scan can tell you, how to prepare for a consistent reading, and how to make sense of changes between scans. You’ll also see how timing and everyday factors can affect comparisons, so you can follow your diet journey with greater clarity and calm.
Key Takeaways
- Look beyond scale weight by comparing body fat and lean mass measurements to understand what is changing during your diet.
- Keep scan conditions consistent and use follow-up readings to spot trends rather than judging progress from a single result.
- Read your results in context: body composition figures offer useful information, but they are not a standalone diagnosis.
- The Glow Up Society’s InBody 270 body composition analysis can help you track changes as you work towards your diet goals.
Table of Contents
- Body fat, lean mass and bone measurements
- Follow-up scans and progress monitoring
- Interpreting body composition results
- What changes in body fat and muscle mass are realistic during a diet?
- The Glow Up Society: Inbody 270 body composition analysis
Body fat, lean mass and bone measurements
A body composition assessment separates changes in weight into different tissue measures. DXA uses dual low-power X-ray beams to distinguish bone mineral, lean mass and fat mass.
These measures add context to a before-and-after comparison. They show which components changed, rather than treating every kilogram as the same kind of progress.
Body fat measurement
Body fat measurement estimates the amount of fat tissue and helps show whether weight loss came largely from fat. Compare the amount and proportion of body fat between readings, alongside total weight, rather than interpreting one result alone.
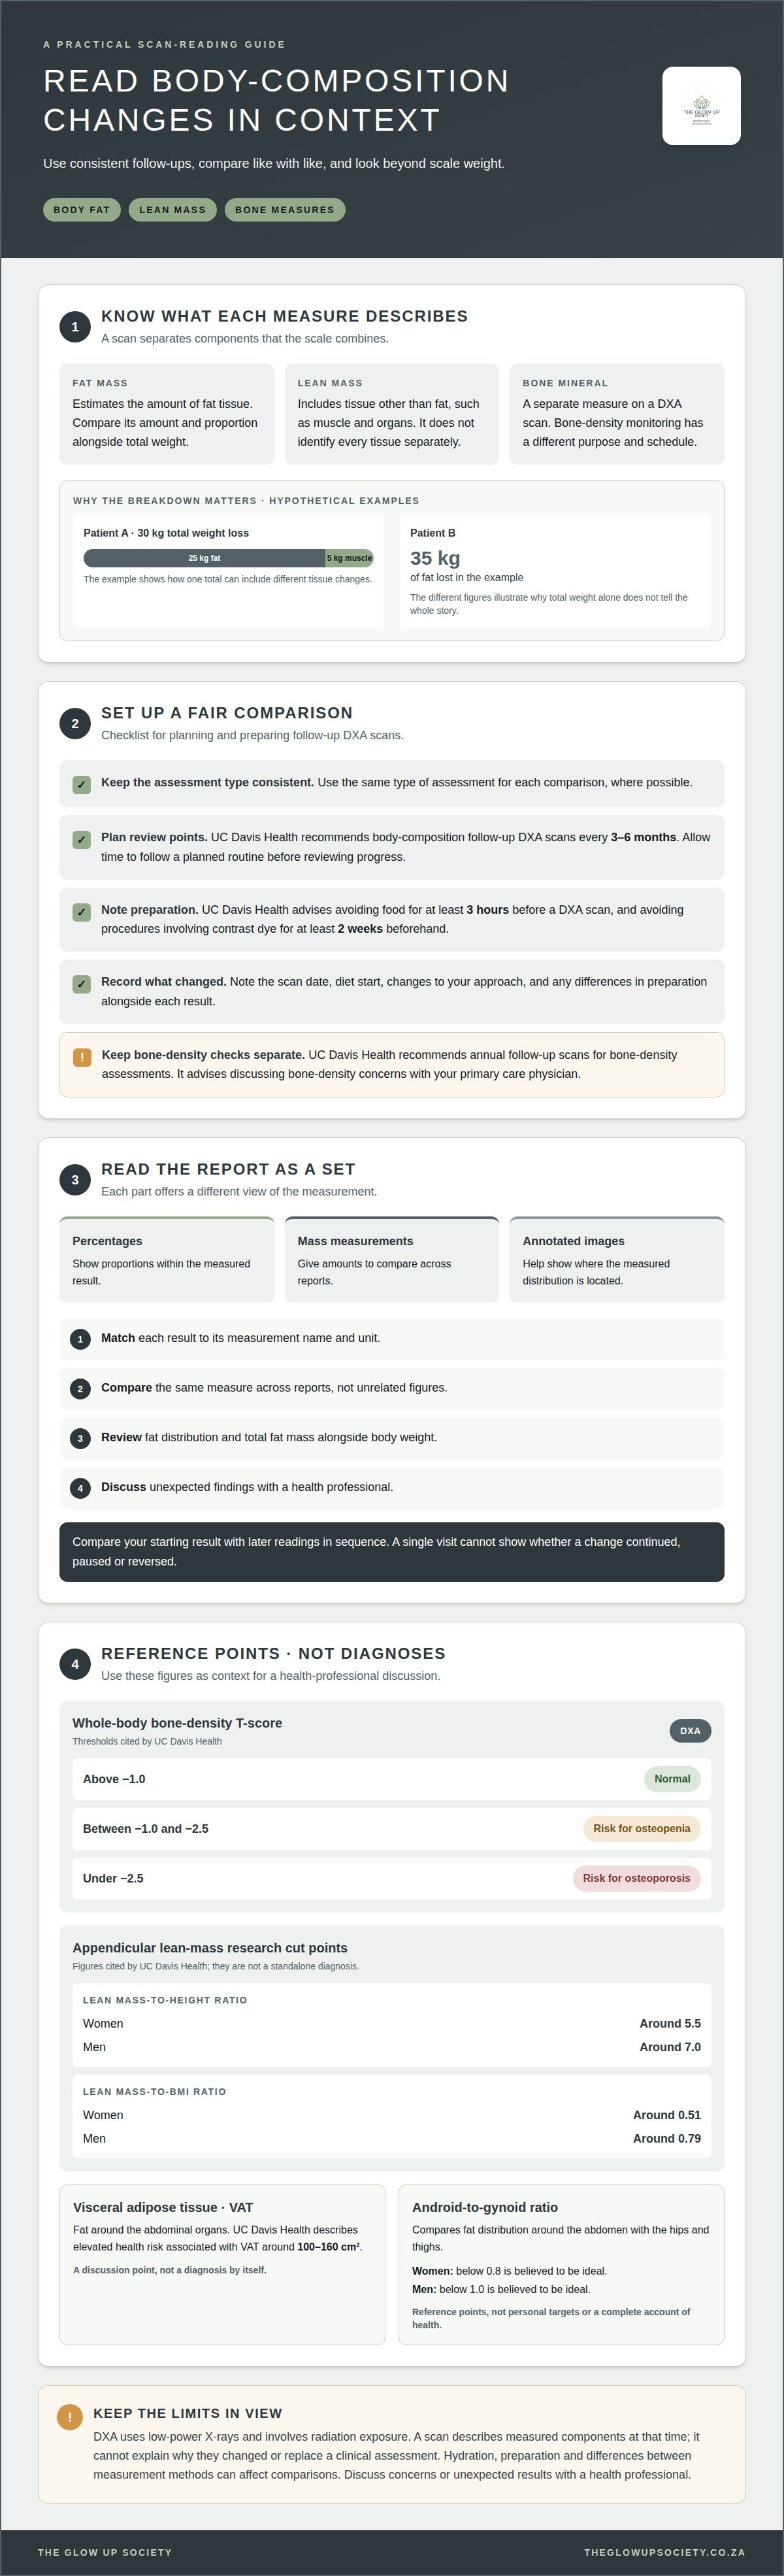
For example, a hypothetical Patient A loses 30 kg, including 25 kg of fat. Patient B loses 35 kg of fat. The different figures illustrate why total weight change does not describe the full composition of a person’s progress.
Lean mass measurement
Lean mass includes body tissue other than fat, such as muscle and organs. A reading can help you notice whether lean tissue changed during a diet, but it does not identify every tissue separately.
In the Patient A example, the 30 kg loss includes 5 kg of muscle. That detail changes how the overall result is understood: the same total weight loss can include different amounts of fat and lean tissue. Review the lean-mass trend with the fat measurement.
Bone mineral is a separate measure on a DXA scan. According to UC Davis Health, a whole-body bone-density T-score above -1.0 is normal; scores between -1.0 and -2.5 indicate a risk for osteopenia, while a score under -2.5 indicates a risk for osteoporosis. These thresholds concern bone density, not diet-related fat loss.
UC Davis Health gives research cut points for appendicular lean mass-to-height ratio of around 5.5 for women and 7.0 for men. For appendicular lean mass-to-BMI ratio, its cut points are around 0.51 for women and 0.79 for men. These measures add detail to lean-mass assessment; they are not a standalone diagnosis. Discuss bone-density concerns with your primary care physician, as UC Davis Health advises.
Follow-up scans and progress monitoring
For body composition analysis before and after a diet in Kyalami, plan follow-up assessments around a clear point in your diet journey. UC Davis Health recommends body composition follow-up DXA scans every 3-6 months. This interval gives you time to follow a planned routine before reviewing its progress, rather than making decisions from frequent snapshots.
Use the same type of assessment for each comparison and organise appointments around your planned review points. A simple timeline can show when your diet began, when your approach changed and when each assessment took place. This helps connect results with the stage of your routine, especially if your approach has shifted between assessments.
Before a DXA scan, UC Davis Health advises avoiding food for at least three hours. It also advises avoiding procedures involving contrast dye for at least 2 weeks beforehand. If either circumstance differs between appointments, record it with the scan date. That way, you can keep the preparation details in view when discussing why two readings may not align neatly.
When reviewing a follow-up, first compare it with your starting result, then look at later readings in sequence. A single visit can’t show whether a change continued, paused or reversed. The series gives you a clearer timeline to discuss and helps you decide what to focus on at your next review.
Bone-density monitoring follows a separate schedule from diet-progress follow-ups. UC Davis Health recommends annual follow-up scans for bone-density assessments and advises people concerned about bone density to follow up with their primary care physician. For body composition analysis before and after a diet in Kyalami, keep the purpose of each appointment clear so the right result informs the conversation.
Interpreting body composition results
A DXA scan uses low-power X-rays, so it involves radiation exposure. Its measurements provide information, not a diagnosis; discuss results with a health professional if they raise concerns.
A report presents percentages, mass measurements and annotated images. Read these together: percentages show proportions, mass gives amounts, and images help locate the measured distribution. Start by identifying the change you wanted to track, then compare the corresponding measures across reports.
Visceral adipose tissue, or VAT, is fat around the abdominal organs. UC Davis Health describes elevated health risk associated with VAT around 100-160 cm2. This range is a point for discussion, not a diagnosis by itself. Consider the result alongside your overall health and other measurements.
The android-to-gynoid ratio compares fat distribution around the abdomen with the hips and thighs. UC Davis Health states that a ratio below 0.8 is believed to be ideal for women, and below 1.0 for men. Treat these as reference points, not personal targets or a complete account of health.
For a useful comparison, take these steps:
- Match each result to its measurement name and unit.
- Compare the same measure across reports, rather than unrelated figures.
- Note whether fat distribution or total fat mass changed alongside body weight.
- Discuss unexpected findings with a health professional.
For example, a lower body weight does not explain whether abdominal VAT also changed. Annotated images and measurements provide different views of the result. Read the full report before drawing conclusions from one figure.
Body composition testing also has limits. A scan describes measured components at that time, but cannot explain why they changed or replace a clinical assessment. Hydration, preparation and differences between measurement methods can affect comparisons, so interpret trends under consistent conditions and, where possible, using the same type of scan.
What changes in body fat and muscle mass are realistic during a diet?
Diet progress can involve changes in both fat mass and lean tissue, so scale weight alone gives only part of the picture. The balance differs between people and across stages of a diet. A body composition comparison helps show whether fat and muscle measurements are moving in the same direction.
One example describes losing 5 kg over a 12-week period whilst losing 8-10 kg of body fat during that period. This is an example, not a standard forecast. Because the reported fat reduction exceeds the scale-weight loss, other measured body components would need to offset part of that change in the overall total.
That distinction matters when you review results. A smaller change in total weight does not necessarily mean body fat stayed unchanged. Likewise, a drop on the scale does not show how much came from fat or muscle. Compare the separate measurements, then consider the time period and your diet progress together.
Muscle mass can also change during weight loss. The amount depends on your individual circumstances and the course of your diet; an assessment can help reveal the direction of change. Avoid treating one result as a prediction for your next reading. Instead, use repeat measurements to understand the pattern and discuss concerns about muscle changes with a qualified health professional.
For a practical review, note your starting measurements, the date of each assessment and the corresponding changes in fat and lean mass. Keep units consistent when comparing reports. If weight falls while fat mass changes differently, review all the measurements rather than assuming the scale tells the whole story.
Use these comparisons to guide a considered conversation about your progress, not to set an expectation based on someone else’s example. To track your own measurements, book a body composition assessment.
The Glow Up Society: Inbody 270 body composition analysis
The Glow Up Society offers InBody 270 body composition analysis to help you follow changes during your diet. It can give you a composition-focused point of comparison alongside your weight, making it easier to review progress in the context of your personal goals.
Consider an assessment when you’re beginning a diet and want a baseline, or as part of ongoing progress monitoring. Comparing results over time can help you discuss changes in body composition and decide what you’d like to focus on next. Readings are one part of your progress picture, not a measure of your effort or worth.
If you’d like to explore body composition analysis for your diet journey, contact The Glow Up Society.
Make your next step personal
Progress is easier to engage with when you decide what you want to understand next. Before your next assessment, consider which changes matter most to your wellbeing and how you’d like to use the information in your routine. A clear personal focus can make each measurement more relevant to your journey.
If you’re considering body composition analysis before and after a diet in Kyalami, The Glow Up Society’s InBody 270 analysis can support your progress tracking. The readings can form part of a wider conversation about your goals, rather than becoming a judgement of your effort. Keep your approach steady, and give yourself room to make considered decisions as your routine develops.
Contact The Glow Up Society to discuss body composition analysis as a next step. Take your progress one thoughtful step at a time.
Frequently Asked Questions
How should I prepare for a body composition test before and after dieting?
For a DXA test, avoid eating for at least three hours beforehand and avoid procedures involving contrast dye for at least 2 weeks before the scan, according to UC Davis Health. Keep a note of the test type and any preparation differences between visits. These instructions apply to DXA; follow the preparation guidance provided for the specific body composition test you’re having.
How often should I repeat body composition analysis during a diet?
For body composition follow-up DXA scans, UC Davis Health recommends an interval of every 3-6 months. This gives you a useful timeframe for reviewing changes during a diet. If your assessments use a different method, keep track of the method and discuss a suitable follow-up rhythm with the professional supporting your progress, rather than assuming DXA timing applies to every test.
How do I compare before-and-after body composition results fairly?
Compare reports from the same type of test, using the same measurement names and units. Note the date and where you were in your diet when each assessment took place. For example, don’t compare a body-fat percentage from one report with a fat-mass figure from another. Review all corresponding results, not just the number that changed most.